Comprehending Standards-Based Testing: Exploring Constraints, and Examining its Influence on Equity
Traditional standards-based testing has long been the primary method for assessing K-12 students in the classroom. State standards provide a framework for teachers to instruct and students to learn. Administrators use temporary assessments, often provided by the states or other benchmark tests, for quarterly evaluations, gaining insights into students’ positions before the annual state tests in spring. Teachers, in turn, rely on this data to tailor their instruction.
Sounds like a logical approach, right? Well not completely. This path can perpetuate or lead to institutional bias that undermines equity.
Using a test focused solely on grade-level standards as a diagnostic tool or instructional guide can be problematic. When a test concentrates only on concepts within a student’s current grade level, teachers may remain unaware of the specific gaps in knowledge for their most vulnerable students. Would it make sense to use a French 3 test to evaluate first-year French students? No, of course not. Would it nevertheless allow you to gauge how students are doing? Yes, it would. The top students would do better. The weaker students would be clustered together with low 0% to 25% scores. This is what happens in our classroom today. We think because a test can scale students from weakest to strongest, it is a good test. Because it can measure growth, it is a good test. This is a huge fallacy! Take math, for example; many urban schools have proficiency scores ranging from 20% to 50%. But what does this mean? Simply put, it means that 15 to 24 students in a 30-student class are below grade-level standards. For middle school, this translates to these students being from 1 to 3 years behind grade level. Thus, these students technically need personalized intervention.
Explore equity-building testing strategies
Let’s Go Learn’s diagnostic assessments help avoid equity problems by discovering skills a student may need below grade level.
Here is another point that illustrates the gravity of the situation. When it comes to math, “proficiency” may not always mean “at grade level.” With Let’s Go Learn’s ADAM (the Adaptive Diagnostic Assessment of Mathematics), skills and concepts are aligned to determine grade-level scores. Thus, ADAM is vertically aligned to the Common Core, TEKS, and other state standards by instructional skills and concepts. It also has a 0.85 correlation to these state tests. Looking at the table below, the 3rd-grade-level students who get a total score of 3.8 or 3.78 are likely to be proficient on the PARCC or SBAC assessments. This makes sense since the decimal grade level of third graders by the end of third grade is 3.9. But by middle school, proficiency is technically one or more years behind. Look at 6th grade: the cut scores of 5.8 and 5.89 determine proficiency. What does this mean? The dirty secret is that our state tests are normative. The cut score for proficiency has been set below grade level; otherwise, we would see proficiency scores that are politically too low in middle school. So even students who score at the proficient level may be one or more grade levels behind in middle school. This means the gaps may be even bigger in reality.

The cut scores for the SBAC and PARCC assessments in grades 3-8, which determine proficiency.
What are teachers and administrators doing about this problem? They are recognizing that there is a role for standards-based testing and a role for true adaptive diagnostic assessments that find students’ zones of proximal development. Special education departments figured this out a long time ago. They know that students with IEPs are generally unique in their abilities. That is why IEPs require teachers to identify students’ present levels and use them to set concrete instructional goals. This is a very important process! Finding present levels simply means finding what students can do at the highest level within a scope and sequence of skills and concepts.
Choosing the Right Tool for Educational Equity
What we are seeing today is that many districts are concerned about equity or simply implementing RtI or MTSS with fidelity. They realize that they need better data with a new generation of diagnostics that actually provide useful information. Unfortunately, many educational assessments on the market today may be adaptive or advertised as being diagnostic but are not at the level required to inform instruction for at-risk students. Assessments that use summative scores, such as single numbers in major areas, and then make comments like “Students are developmentally ready to learn…” or “Students should be able to…” are doing a disservice to schools and districts by attempting to apply this data to individual student pathways. This is technically a faux pas and arguably ethically wrong as well.

In general education classes, using benchmark or standards-based testing only works when the majority of students are at grade level, meaning proficiency levels on state tests of 80% or higher. However, we know this does not apply to the majority of classrooms in urban districts. Teachers need better data. There is a term, DRIP, that means “data rich, information poor.” That is what happens when teachers have to rely solely on standards tests or on the data that district administrators push on them. They are given a lot of data, but it doesn’t inform their support of their students. You cannot give the same scaffolding to 50% of your students when they are all below grade level. Yes, teachers can try to differentiate, and some core programs have small group breakouts. But there is too little time allocated to scaffolding and the ability of core programs to support personalized learning is generally weak.
Build data designed to reduce equity issues
Use granular diagnostic assessments that truly inform instruction for at-risk students.
Another simple step administrators are taking is to adopt classroom assessments that teacher review teams find useful for their classrooms. Fortunately, diagnostic assessment scores can generally be rolled up to provide summative data. But the converse is not true. Summative data–like readability scores, just fluency rate, or math strand scores–does not roll downward to inform individual student gaps and intervention prescriptions.
Another way to address this issue is to adopt the special education process. Does this data determine a student’s present levels of achievement? Can we as a district administer an online assessment that will adapt up and down across K-8 skills and concepts and find each student’s present level (and thus each student’s zone of proximal development, which is one skill/concept above) easily and accurately? This is the new gold standard that will ensure equity and break the cycle of institutional bias. Make no mistake: failure to implement the best assessments to support classroom teachers perpetuates institutional bias, which hurts the neediest populations of students and contributes to disproportionality.
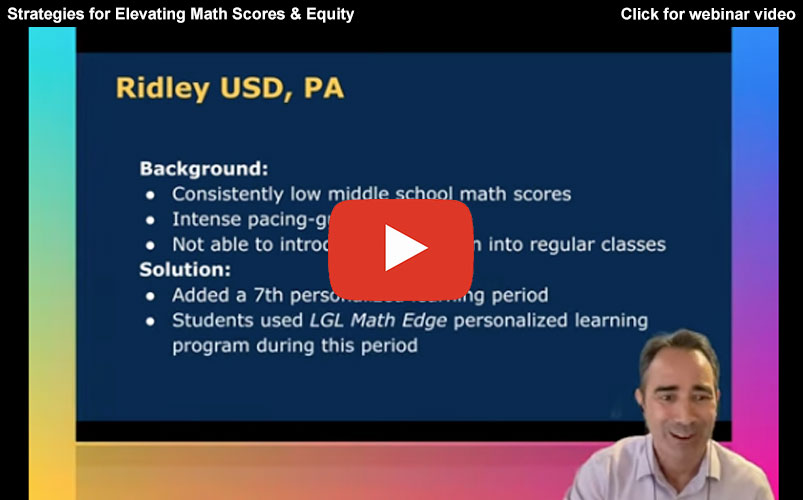
Webinar: Strategies for Elevating Math Scores and Amplifying Achievement
Yes, math proficiency scores in the U.S. are dismal. But you don’t have to join the median outcome! Become an outlier! Understand the structural issues in K-12 math implementation and change the formula driving your math outcomes.
In this short 30-minute webinar, hear from Richard Capone, CEO of Let’s Go Learn and Co-Founder, as he explores five case studies of districts that have turned their math programs around. Learn the secrets behind their success in becoming math outliers.