By Christina Barragan & Alicia Atkinson
What constitutes granular data?
Granular data breaks information down into its most detailed parts. In any assessment, the data can be broken down into tiers of granularity. The broadest assessment data is represented by the summative score. From there, the data can be broken down by mathematical strand (ex: numbers and operations), state-level standard, topic/subsection (ex: addition), or skill (ex: adding single-digit numbers). When looking at student math scores, the most granular assessment data includes each question on a math assessment.
How to assess students to get
the data you need
Standards-based and benchmark assessments do not provide granular data. Standards are broad concepts that students need to master in order to show competency in a particular area, but they intertwine multiple concepts, which makes it difficult to suss out specific skills. For example, the Common Core standard 5.NBT.7 states that students will “add, subtract, multiply, and divide decimals to hundredths, using concrete models or drawings and strategies based on place value, properties of operations, and/or the relationship between addition and subtraction; relate the strategy to a written method and explain the reasoning used.” If a student were to show “non-mastery” on this standard, you would be unable to use this data to pinpoint a specific skill gap. Benchmark assessments also look at broader grade-level skills after instruction has been given.
To get actionable granular data, choose an assessment that breaks mathematical concepts down into their individual parts. Adaptive assessments allow you to gather this level of data by meeting students where they are. Granular assessments may take longer to administer, but the granularity will allow you to save time later in your instruction. Because of this, it is important to assess students with a comprehensive diagnostic at the beginning of the year and to monitor student progress as instruction continues. Student progress can be monitored at a more granular level throughout the year by breaking down a more expansive assessment into smaller parts.
Let's Go Learn's diagnostic assessments
With Let’s Go Learn, you can create personalized instruction that inspires success for each learner, as you differentiate curriculum for intervention, remediation, and enrichment.
How to translate granular data
into student success
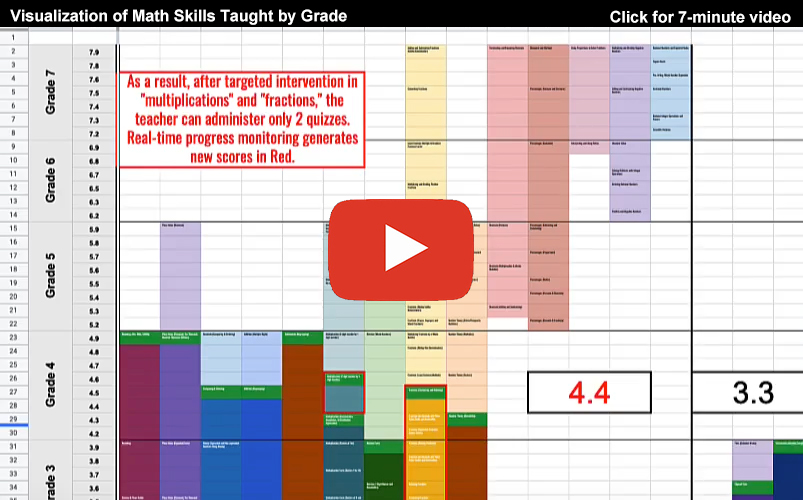
Once your students have taken a comprehensive assessment, it’s time to review the data and look for trends. Watch for general areas where students are struggling the most. Then focus on more specific concepts within these areas that require more attention. If your data is granular enough, you can drill down to the specific skills in which each student needs instruction. For example, the school below noticed that their students had needs in the area of numbers and operations.

From there, they were able to identify that the concept of fractions was a struggle for most students. By using granular data, they were able to pinpoint exactly which skill each student needed to improve. Finally, they used small-group instruction to work on these skills. They were able to see progress in fractions on their next assessment.

Lesson plan template
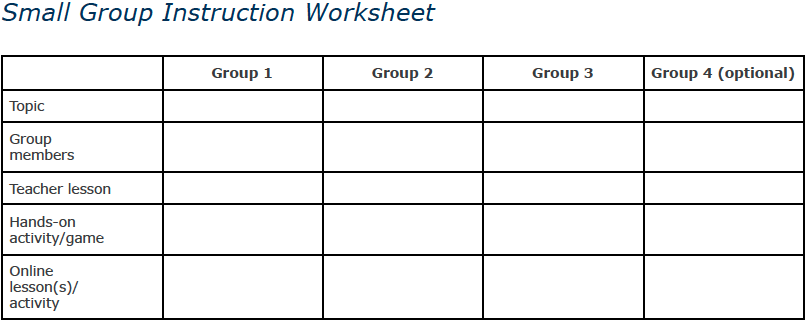
Small-group instruction is just as important in mathematics as when teaching students to read. However, structuring the classroom for small groups in math can be daunting. Below is an example of how you can use granular data to teach students what they need to learn.

Download a small group instruction worksheet by clicking the image below…
Tips:
- Ideal group size is 3-10 students.
- Groups can include multiple levels of the same topic. For example, in the report above, we have multiple students who need to work on subtracting fractions. Within one group, we might have some students working on subtracting fractions with like denominators while others work on subtracting fractions with unlike denominators.
- Some easy hands-on activities include Bingo (for example, with converting fractions, the Bingo card could include decimals while the Bingo “balls” are labeled with fractions), classic board games where completing problems gets you further along the game board, and Go Fish-style card games where students are matching questions and answers.
- Online lessons and activities can include teacher-created assignments or assessment-data-driven lessons.
Understanding Let’s Go Learn’s Granular Data
While there are many online diagnostic assessments to choose from, the video below (coming in late January, 2023) explains in detail the level of granularity found within Let’s Go Learn’s assessments. With this granular data, teachers can quickly pull the skill-specific reports they need in order to create their small groups and plan instruction. The more detailed the data, the higher the chance of success.